tsmap User Guide
tsmap loads semiconductor wafer map data from STDF, ATDF, CSV, and JSON files and renders interactive yield maps, parametric heat maps, and statistical charts. It runs as a native desktop application on Linux, macOS, and Windows, and as a browser app at telecasterer.github.io/tsmap/app/.
This guide covers tsmap's own side of the workflow: opening files, column mapping, test filtering, splits, and the command line. The wafer map itself, its toolbar, and every Insights tab panel (yield, bin pareto, process capability, boxplot, histogram, correlation, scatter) are a separate library, wmap, with its own built-in guide covering all of that in full — open it any time via the toolbar's ? menu → Wafer map reference (enabled once a file is loaded). This guide doesn't repeat that material.
1. Supported file formats
| Format | Extensions | Notes |
|---|---|---|
| STDF v4 | .stdf, .std |
Binary; PTR (parametric) and FTR (functional) records; multi-wafer lots |
| ATDF | .atdf, .atd |
ASCII equivalent of STDF; same data, same features |
| CSV | .csv, .txt, .dat |
Tab, semicolon, and comma auto-detected; wide and long (pivot) formats |
| JSON | .json |
Flat array of die objects or nested [{ wafer, results: [{die}] }] |
| Gzip | .gz |
Transparent decompression — e.g. lot.stdf.gz |
| Zip | .zip |
All contained files extracted and loaded as a batch |
STDF and ATDF are always parsed natively — never attempt to open them in a text editor or spreadsheet. CSV and JSON require a column mapping step before the data is parsed.
2. Opening files
Installing past security warnings
tsmap's installers are not code-signed, so your operating system may warn that the app is from an unknown or unidentified developer the first time you run it. This is expected — it reflects the absence of a paid signing certificate, not a problem with the app. The steps below let you install anyway. If you would rather not install at all, the browser version runs with no download.
Windows — SmartScreen shows a blue "Windows protected your PC" dialog when you run
tsmap-<version>-windows-x64.msi (or the -setup.exe installer). Click More info, then
Run anyway. The warning fades as more people install the app.
macOS — Gatekeeper blocks the app with "tsmap can't be opened because it is from an
unidentified developer." After mounting the .dmg
(tsmap-<version>-macos-apple-silicon.dmg for M-series Macs, -macos-intel.dmg for Intel)
and dragging tsmap to Applications, right-click the app in Applications and choose
Open, then click Open in the dialog. You only need to do this once. If macOS instead
says the app is "damaged and can't be opened" — common on Apple Silicon for downloaded
unsigned apps — clear the quarantine flag in Terminal:
xattr -dr com.apple.quarantine /Applications/tsmap.app
Linux — the .deb, .rpm, and .AppImage builds run normally; any warning is just a
browser download nag. For the AppImage, mark it executable first:
chmod +x tsmap-*-linux-x86_64.AppImage
./tsmap-*-linux-x86_64.AppImage

The colour theme picker sits at the right end of the toolbar, next to the help button. Choose Auto to follow your system's light/dark setting, or pick a theme explicitly — Light, Light green, Solarized Light, High contrast, Dark, Nord, Solarized Dark. Your choice is remembered.
Open file
Click Open file in the toolbar to open a file picker. You can select one file or multiple files at once. On the desktop the picker opens a native OS dialog; in the browser it opens the browser file dialog.
Loading sample data
The empty state has a Load sample data button that loads a bundled synthetic lot — 13 wafers across 5 process corners — through the normal load flow (test selector included), so you can see tsmap working before opening your own files. Available on both desktop and browser. Its process-corner splits apply automatically, so the loaded lot is ready to explore with Group by → Split right away.
Drag and drop
Drop one or more files anywhere in the window. This is equivalent to selecting them through the file picker and is supported on both desktop and browser.
Recent files
Desktop only. The Recent button lists the last 8 file sets you've opened, each showing
when it was last loaded (Today 14:32, Yesterday 09:05, or a date for older entries).
Click an entry to reopen it — this replaces the current view the same way Open file
does, so it's not a way to append. Click the × next to an entry to remove it from the
list. Recent is available whenever you have history, whether or not a file is currently
loaded — not just from the empty state. Not shown in the browser version, since reopening
requires a native file path that browser file pickers don't provide.
Command line
Desktop only. Launch tsmap with files already named, for scripting or automation:
bash
tsmap lot1.stdf lot2.stdf                  # one or more data files
tsmap --list files.txt                     # a text file of paths, one per line
cat files.txt | tsmap                      # or piped via stdin
tsmap lot1.stdf --tests my-tests.csv       # pre-fills the test selector (still shown — see below)
tsmap lot1.stdf --splits my-splits.csv     # applies splits automatically, same as sample data
tsmap --help                               # full usage
--tests takes the same file a test selector's Save list button produces — selection,
renames, and optionally spec limits/test type (see
Test lists above) — and --splits the same CSV the
Splits… dialog saves and loads. --tests only
pre-fills the selector's checkboxes, renames, and limit/type overrides — the overlay still
always appears and still needs a confirm click, the same as any other load; it just saves
re-picking (and re-entering limits for) tests you already set up before.
If tsmap is already running, launching it again with files hands them to the running window instead of opening a second blank one: with nothing currently loaded they open right away; with data already loaded, a dialog asks whether to replace it. Decline and the new files open in a separate, independent tsmap window instead, so nothing is lost either way.
Adding files to an existing lot
Once a file is loaded, the Add files button becomes active. Use it to append additional wafers to the current gallery — it goes through the same column mapping / test selector / rename steps as a fresh load, then shows a confirmation dialog before merging into the current gallery:
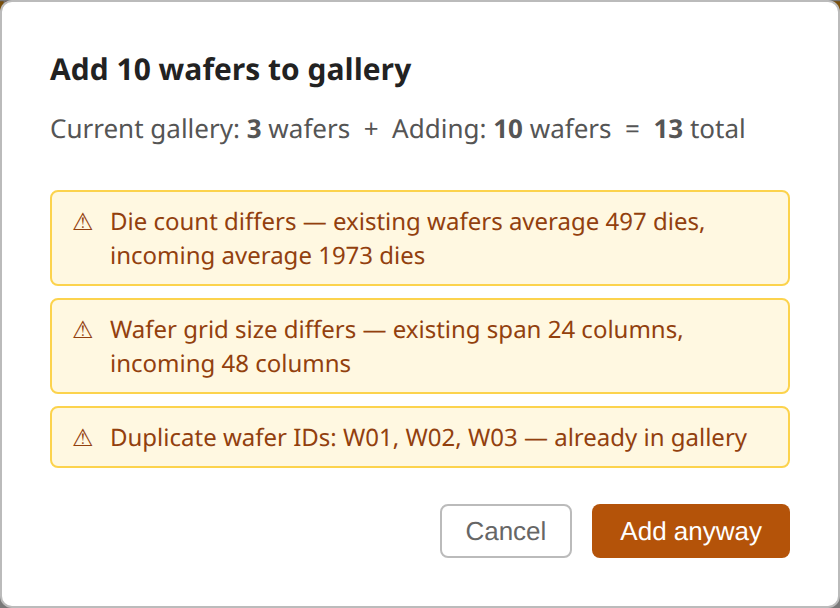
The dialog summarises the incoming wafers and warns about structural mismatches (different die count, different hard bin set, duplicate wafer IDs). With no mismatches, the button reads Add to gallery; if there's a warning to acknowledge, it reads Add anyway. Click Cancel to keep the current data unchanged.
Clearing data
Click Clear to unload all data and return to the empty state.
What happens next
After selecting files, what happens depends on the format:
| Format | Next step |
|---|---|
| STDF / ATDF | Test selector overlay always appears first |
| CSV / JSON | Column mapping overlay appears first |
| Multiple files | Wafer rename overlay appears before rendering |
2.1 Wafer rename overlay
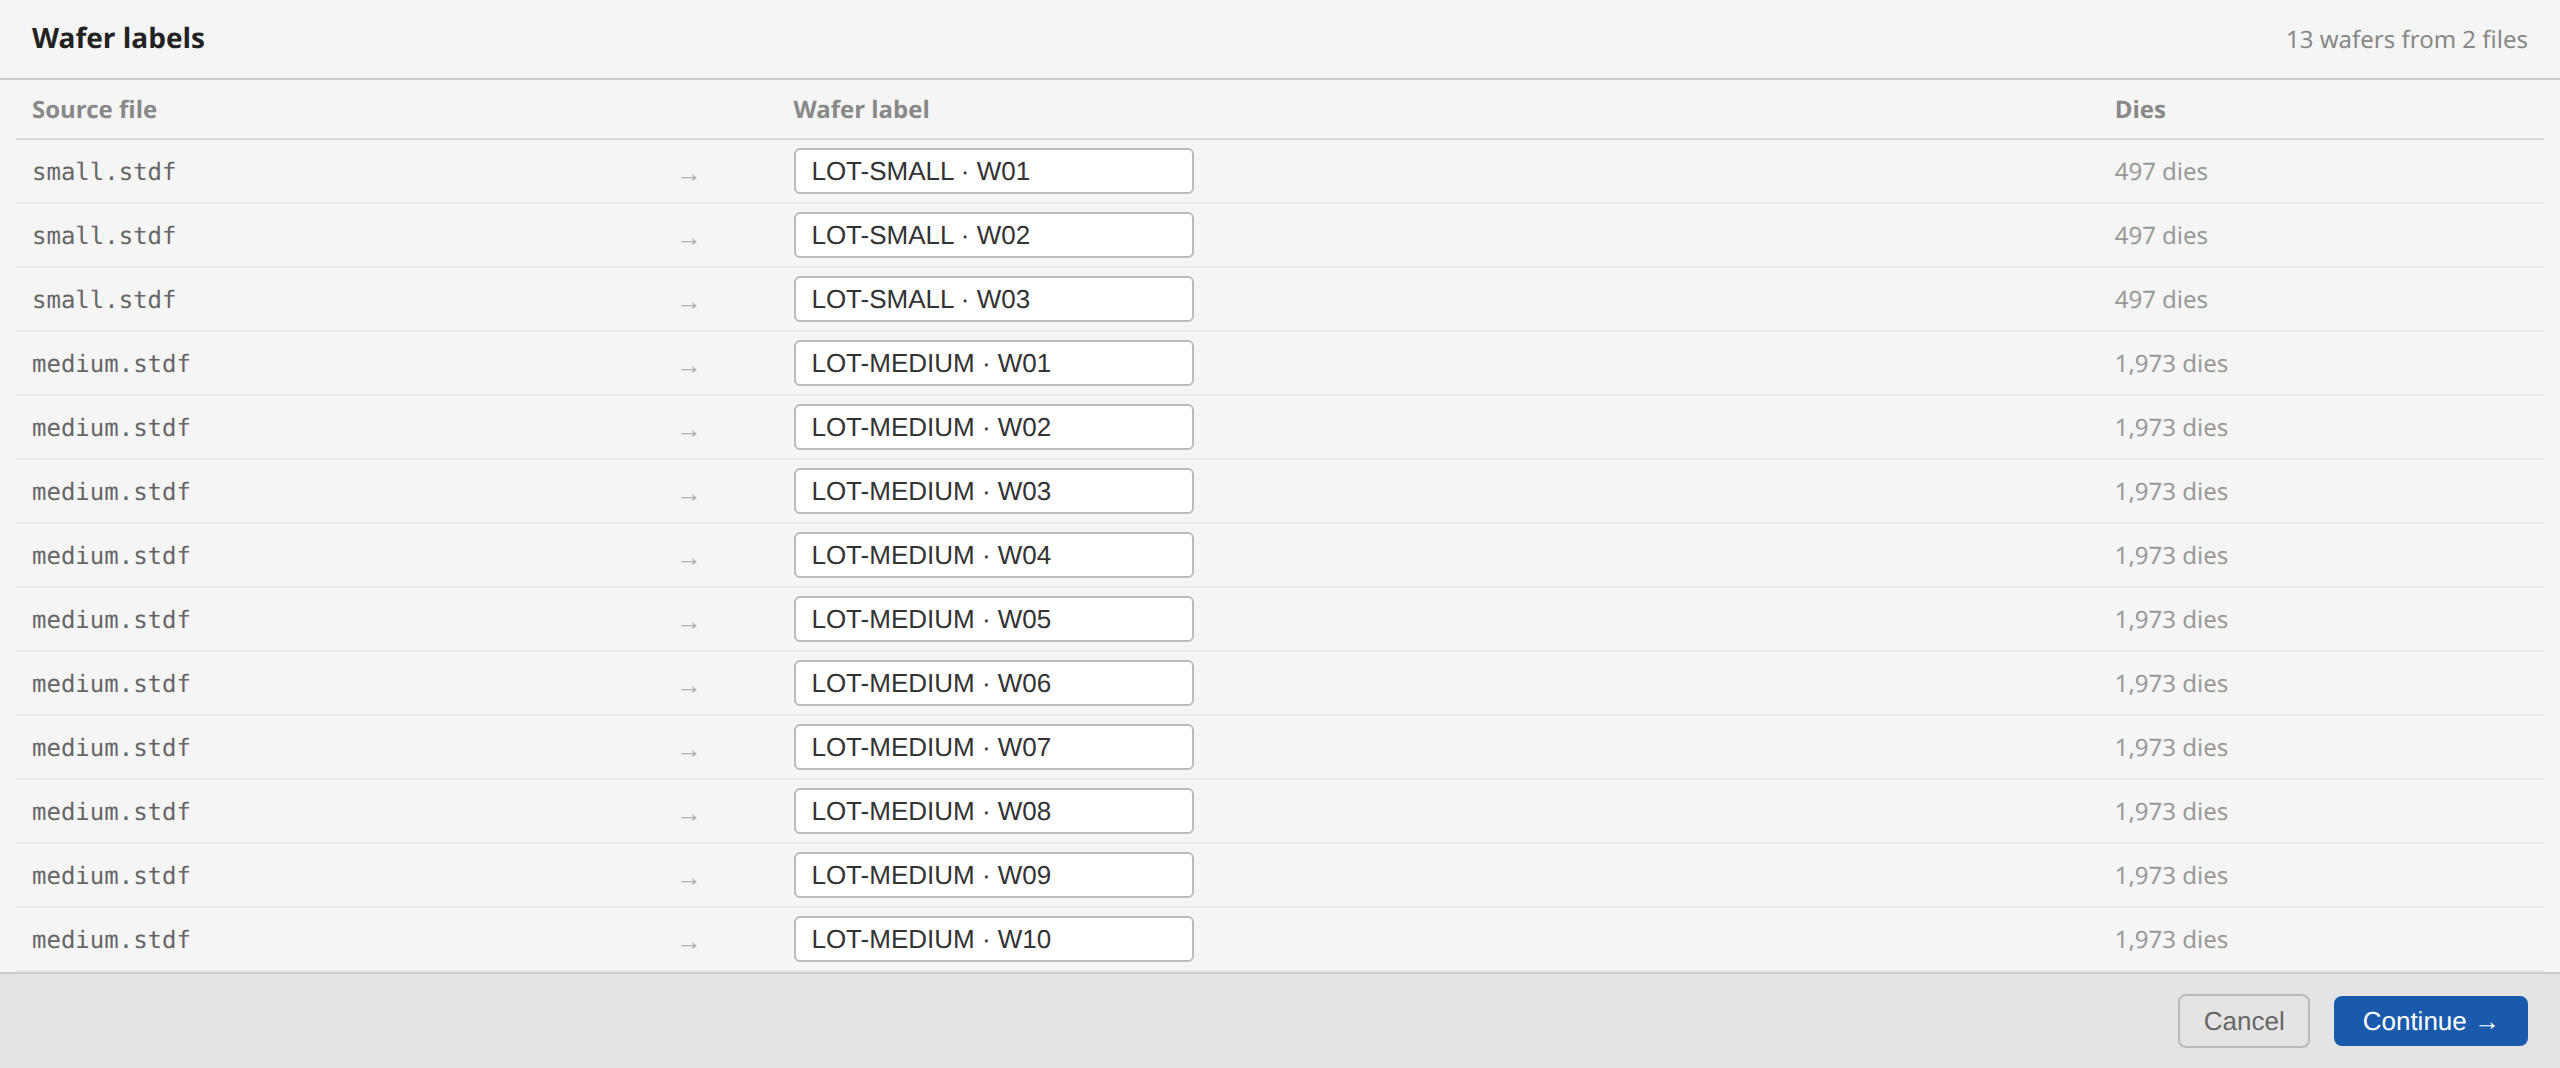
When loading multiple files (or a zip containing multiple files, or a single file whose
only wafer has a generic ID like W01), tsmap shows a rename overlay listing each wafer
with an editable label. Labels are pre-filled from whatever identifies the wafer in the
data — a distinctive wafer ID is used as-is; a generic one (W01) is combined with the
lot ID (LOT-A · W01) so wafers stay distinct within and across lots without you needing
to edit anything; with neither, it falls back to the file name. Edit any label that needs
changing, then click Continue →.
3. Column mapping (CSV and JSON)
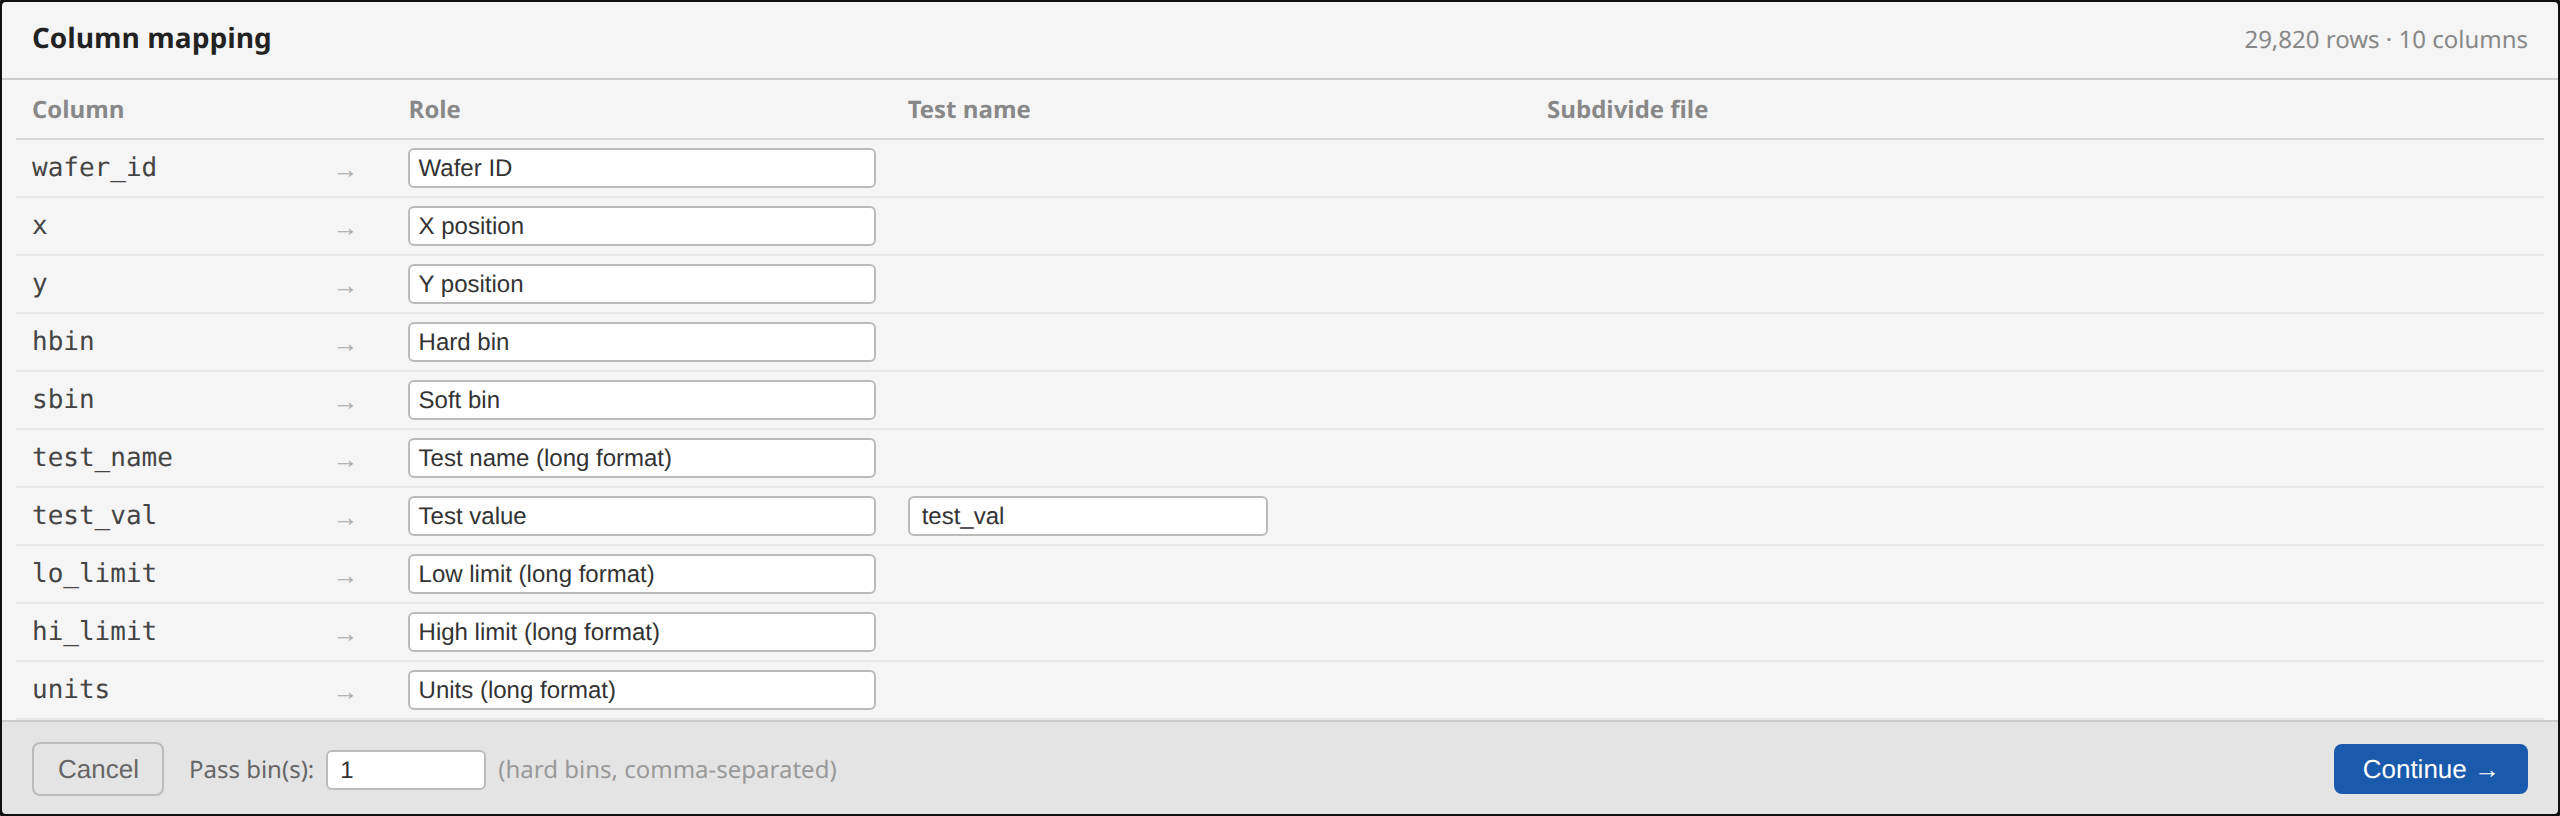
CSV and JSON files don't have a fixed schema, so tsmap shows a column mapping overlay
before parsing. It lists every column in the file with a dropdown to assign its role.
Common column names (x, hbin, result, lo_limit, etc.) are detected automatically
and pre-filled.
Role reference
| Role | What it means |
|---|---|
| X position | Die column coordinate (prober step, integer). Required. |
| Y position | Die row coordinate (prober step, integer). Required. |
| Hard bin | Hard bin number per die |
| Soft bin | Soft bin number per die |
| Wafer ID | Identifies which wafer each row belongs to; splits rows into separate wafer maps |
| Lot ID | Lot identifier shown in the summary panel |
| Test site | Parallel-test site number for each die (the STDF site_num equivalent). Dies from all sites share one wafer map; the site appears in the die hover tooltip and can be used as a chart grouping/colour dimension. Numeric values only. |
| Test value | Numeric test result (wide format — one column per test); the Test name field to the right sets the display name for that test |
| Test name (long format) | Column containing the test name in a long/pivot layout |
| Test result (long format) | Column containing the numeric result in a long/pivot layout |
| Low limit (long format) | LSL in a long-format file |
| High limit (long format) | USL in a long-format file |
| Units (long format) | Units string in a long-format file |
| Display info | Additional metadata captured for grouping/comparison (and shown in tooltips). The Subdivide file by this column checkbox is a structural escape hatch for flat files that pack several wafers into one file with no wafer column — it subdivides the file into one wafer map per distinct value of the column. (Do not use it for parallel-test sites — map those to Test site instead.) |
| — ignore — | Column is not imported |
Wide vs long format
Wide format has one column per test (the most common layout from prober exports). Assign each test column the Test value role and fill in the test name.
Long format has one row per die per test (each row includes a test name column and a result column). Assign the Test name (long format) and Test result (long format) roles; optionally assign the limit and units columns too. tsmap detects likely long-format files automatically and shows a prompt if multiple rows share the same X/Y coordinates.
Examples:
Wide format — one column per test:
x, y, hbin, Vt_lin, Idsat_vg1
1, 1, 1,    452,    185
2, 1, 2,    438,    179

Long format — one row per die per test:
x, y, hbin, test_name,  result
1, 1, 1,    Vt_lin,     452
1, 1, 1,    Idsat_vg1,  185
2, 1, 2,    Vt_lin,     438
2, 1, 2,    Idsat_vg1,  179
Pass bins
The Pass bin(s) field at the bottom of the overlay specifies which hard bin values are
treated as pass for yield calculation. Default is 1. Enter multiple bin numbers separated
by commas (e.g. 1,7).
Saved mappings
Once you click Continue →, the mapping is saved and automatically restored the next time you open a file with the same set of column names. If the columns have changed, the overlay re-appears with fresh auto-detection.
4. Test selector (STDF and ATDF)
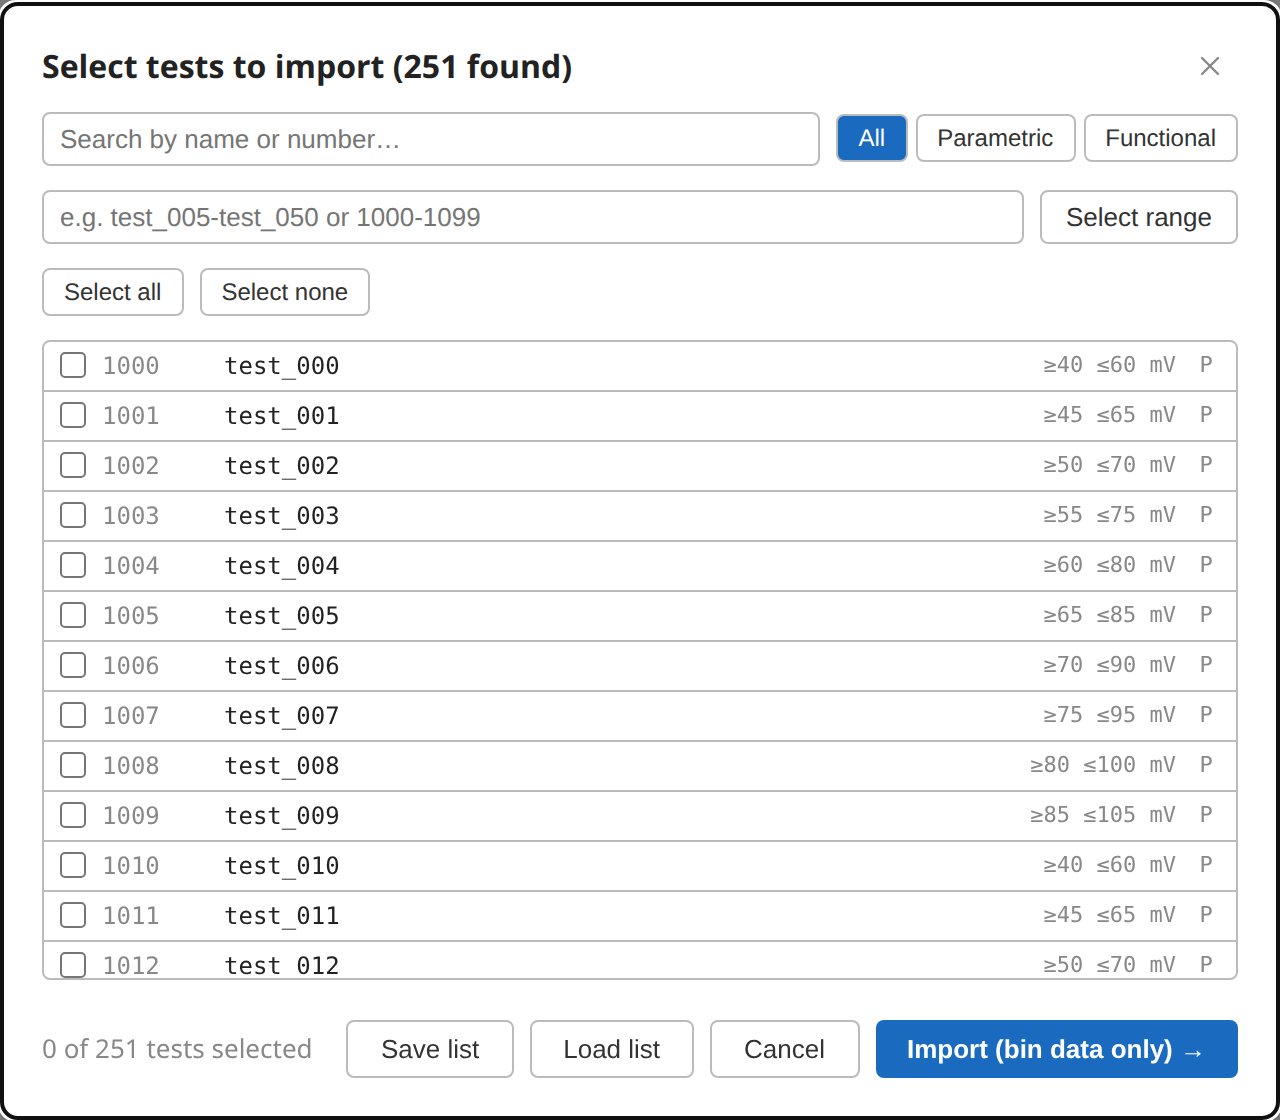
STDF and ATDF files from production testers often contain hundreds of parametric and functional tests. tsmap always shows a test selector overlay before the full parse so you can choose which tests to import. This keeps memory usage and load time proportional to what you actually need.
tsmap uses a two-pass approach: a fast first pass reads only the test record headers (PTR/FTR) to enumerate all tests and their numbers, names, units, and spec limits — without accumulating any die data. The selector is built from this scan. The full parse then runs only for the tests you selected, skipping accumulation for everything else. For a 25-wafer lot with 500 tests and 10 000 dies per wafer, selecting 20 tests instead of all 500 reduces the in-memory dataset by roughly 25×.
Controls
- Search — Filter the list by test name or test number. Results update as you type.
- Type filter — Show all tests, only Parametric (PTR), or only Functional (FTR). The count per type is shown on each button.
- Range select — Type a numeric range (
1000-1099) or a name-based range (Idsat_vg1-Idsat_vg5) in the range input and click Select range. Matching tests are added to the selection. - Select all / Select none — Apply to the currently visible list (respects any active search filter).
- Shift-click — Click one checkbox, then Shift-click another to select or deselect the entire range between them.
Each test row shows the test number (in dim monospace), the test name, and — where defined
in the file — the units and spec limits. If a Load list (or --tests) has overridden a
test's limits, units, or type, the row shows those overridden values, with a tooltip noting
they were loaded from file.
Renaming a test
Click into a test's name to edit it directly — the field looks like plain text until you hover or focus it. Press Enter or click away to commit the new name; press Esc to discard the edit and restore the previous name. Renaming only changes the display name — nothing in the underlying data file changes — and the new name appears everywhere that test is shown: the selector, the map tooltip, and chart axis labels. Renames persist across Filter tests… re-opens and are included when you Save list.
Test lists (Save / Load)
The Save list and Load list buttons let you persist a selection and reuse it across sessions or files from the same product. Beyond just the selection and display names, a test list can also carry spec limits and test type — useful when a test program ships without limits (common for characterisation/test-vehicle work, where limits come from simulation or are defined and adjusted separately), or when you need to correct a test's parametric/ functional classification. In effect, the file doubles as a lightweight test-definitions file.
Saving writes a plain-text .csv file with every selected test's number, current display
name, and current effective limits/units/type. Loading reads that file back, restores the
selection, and applies whatever the file specifies as overrides on top of the parsed data —
so renamed tests stay renamed, and any loaded limits/type replace what the test program shipped
with (or fill in limits it didn't have at all).
The saved format is one test per line, with a header naming the columns:
# tsmap test list
# Saved: 2026-06-15T10:00:00.000Z
num,name,loLimit,hiLimit,units,testType
1000,Idsat_vg1,0.1,1.5,mA,P
1001,Idsat_vg2,,,mA,P
1010,Vt_lin,,,,
- Lines starting with
#are comments and are ignored on load. - Legacy format (still fully supported):
<test number> <display name>, with the number and name separated by a comma, semicolon, or plain whitespace, and no further columns. A line with just a number selects that test without overriding its name. Old saved files keep working unchanged. - Extended format: comma-separated, optionally starting with a header row that names each
column. Column names are matched case-insensitively, and common synonyms are recognized —
lsl/usl(orlo/hi,low/high) for the limit columns,typefor test type. A header lets you list columns in any order, and omit ones you don't need — for example a pure limits file with no name column at all,num,lsl,usl, is valid. Without a header, comma-separated rows are read positionally asnum,name,loLimit,hiLimit,units,testType. testTypeacceptsP/p(parametric) orF/f(functional).- Limits only make sense for parametric tests — a functional test is pass/fail with no
measured value to check a spec limit against. A
loLimit/hiLimitgiven for a test that is (or is being reclassified to) functional is dropped with a warning; the rest of that row's overrides (name, units, type) still apply. - A blank field means "don't override this" — it leaves the parsed value (or an override already loaded earlier in the session) alone. It never clears an existing value back to blank/zero. There's no way to revert an override from inside the app short of editing the file (blank the cell) or reloading the data fresh — Save/Load is the entire limit/type editing workflow, there is no in-app limit editor.
- A field tsmap can't parse (garbage numeric value, invalid test type, an unrecognized header column) is dropped with a log warning — the rest of that row, and the rest of the file, still load normally.
- Tests in the file that are not present in the current scan are silently skipped (the log panel shows a count of skipped tests).
You can hand-edit a list file to rename tests, or add/adjust limits, without changing anything
in the original data file — e.g. 1000,Threshold Voltage,0.2,1.2,mA,P. Those names, limits,
and type appear in the selector, on the map tooltip, in chart axis labels, and — for
limits — as histogram LSL/USL lines and in the Process Capability panel.
Memory advisory
The footer shows how many tests are selected and estimates the memory footprint (selected tests × total die count):
- Amber — large selection (roughly 50 million die×test pairs); the import will be slow.
- Red — very large selection (roughly 200 million die×test pairs); risk of running out of memory. You'll be asked to confirm before the import starts.
If you select no tests, tsmap asks you to confirm ("No tests selected — only bin data will be loaded. Continue?") before importing — the bin map is still fully usable with no tests selected.
After load: re-filtering
After a successful load, the Filter tests… button appears in the toolbar. Click it to re-open the test selector at any time and change which tests are imported. The file is re-parsed with the new selection — bin and yield data is preserved regardless of which tests you select.
For multi-file batches, the selector is shown once and the same selection is applied to all files. By default the test list is scanned from the largest file only — a fast, representative default. If a test appears only in a smaller file (so it's missing from the list), click Scan all N files in the selector to re-scan every file and merge the full test list; your current selection is preserved. The "Filter tests…" dialog offers the same toggle if you didn't widen the scan at load time.
5. The wafer map view
After parsing, tsmap renders the wafer map. A single-wafer file shows one full-screen map with the summary panel open by default; a multi-wafer lot shows a side-by-side gallery.
The map is delivered by the wmap rendering engine. For a full walkthrough of toolbar controls, plot modes, overlays, zoom and pan, die hover tooltips, findings panel, summary panel, and gallery controls, click the ? help button in the map toolbar.
Value findings
The wafer map's summary panel has a Findings list — statistically significant spatial patterns: regions of the wafer (edge ring, quadrants, clusters, test sites) with unusually low yield or distinctive bin patterns. These yield and bin findings are fast to compute and always on.
The Value findings toolbar control is a toggle (shown with a ☐ / ☑ checkbox) that adds one more category to that same Findings list: regions that read unusually high or low on a specific test value, or fail spec more often there than elsewhere ("the edge ring reads 8% high on VDD_CORE"). This is the only thing it changes. It does not affect:
- the panel's per-test Min/Mean/Max statistics (always shown),
- test-value maps or stacked value maps,
- the Insights tab (boxplots, histograms, scatter, correlation — all independent).
Because this regional value pass scales with regions × tests × dies, it is off by default to keep loads fast. The toggle appears once a file with test values is loaded; switch it on and the maps re-render with the extra findings in the panel — the wafer's data is already in memory, so this recomputes in place with no reload. Switch it off to remove them. It resets to off each time you load a new file, and is disabled while the Insights tab is open (it only affects the map's summary panel).
6. Wafer splits
A split is a name you assign to a wafer that isn't in the file at all — most commonly a
process corner (TT, FF, SS, FS, SF), but it can be anything: an experiment
condition, a test-temperature group, anything you want to compare wafers by that your
tester didn't record. Once assigned, splits behave exactly like any other metadata field
in the Insights tab's Group by dropdown — split-vs-split
yield, boxplots, histograms, correlation, and scatter all work immediately with no extra
setup — and they can optionally be shown right on the wafer map/gallery labels too.
Once a file is loaded, click Splits… in the toolbar to open the assignment dialog. The banner at the top shows where things stand: with no assignments yet it points you at the two ways to get started (assign below, or load a saved CSV), and once splits exist it becomes a summary — e.g. "5 splits assigned to 13 of 13 wafers" — so a lot whose splits were restored automatically reads as already done:
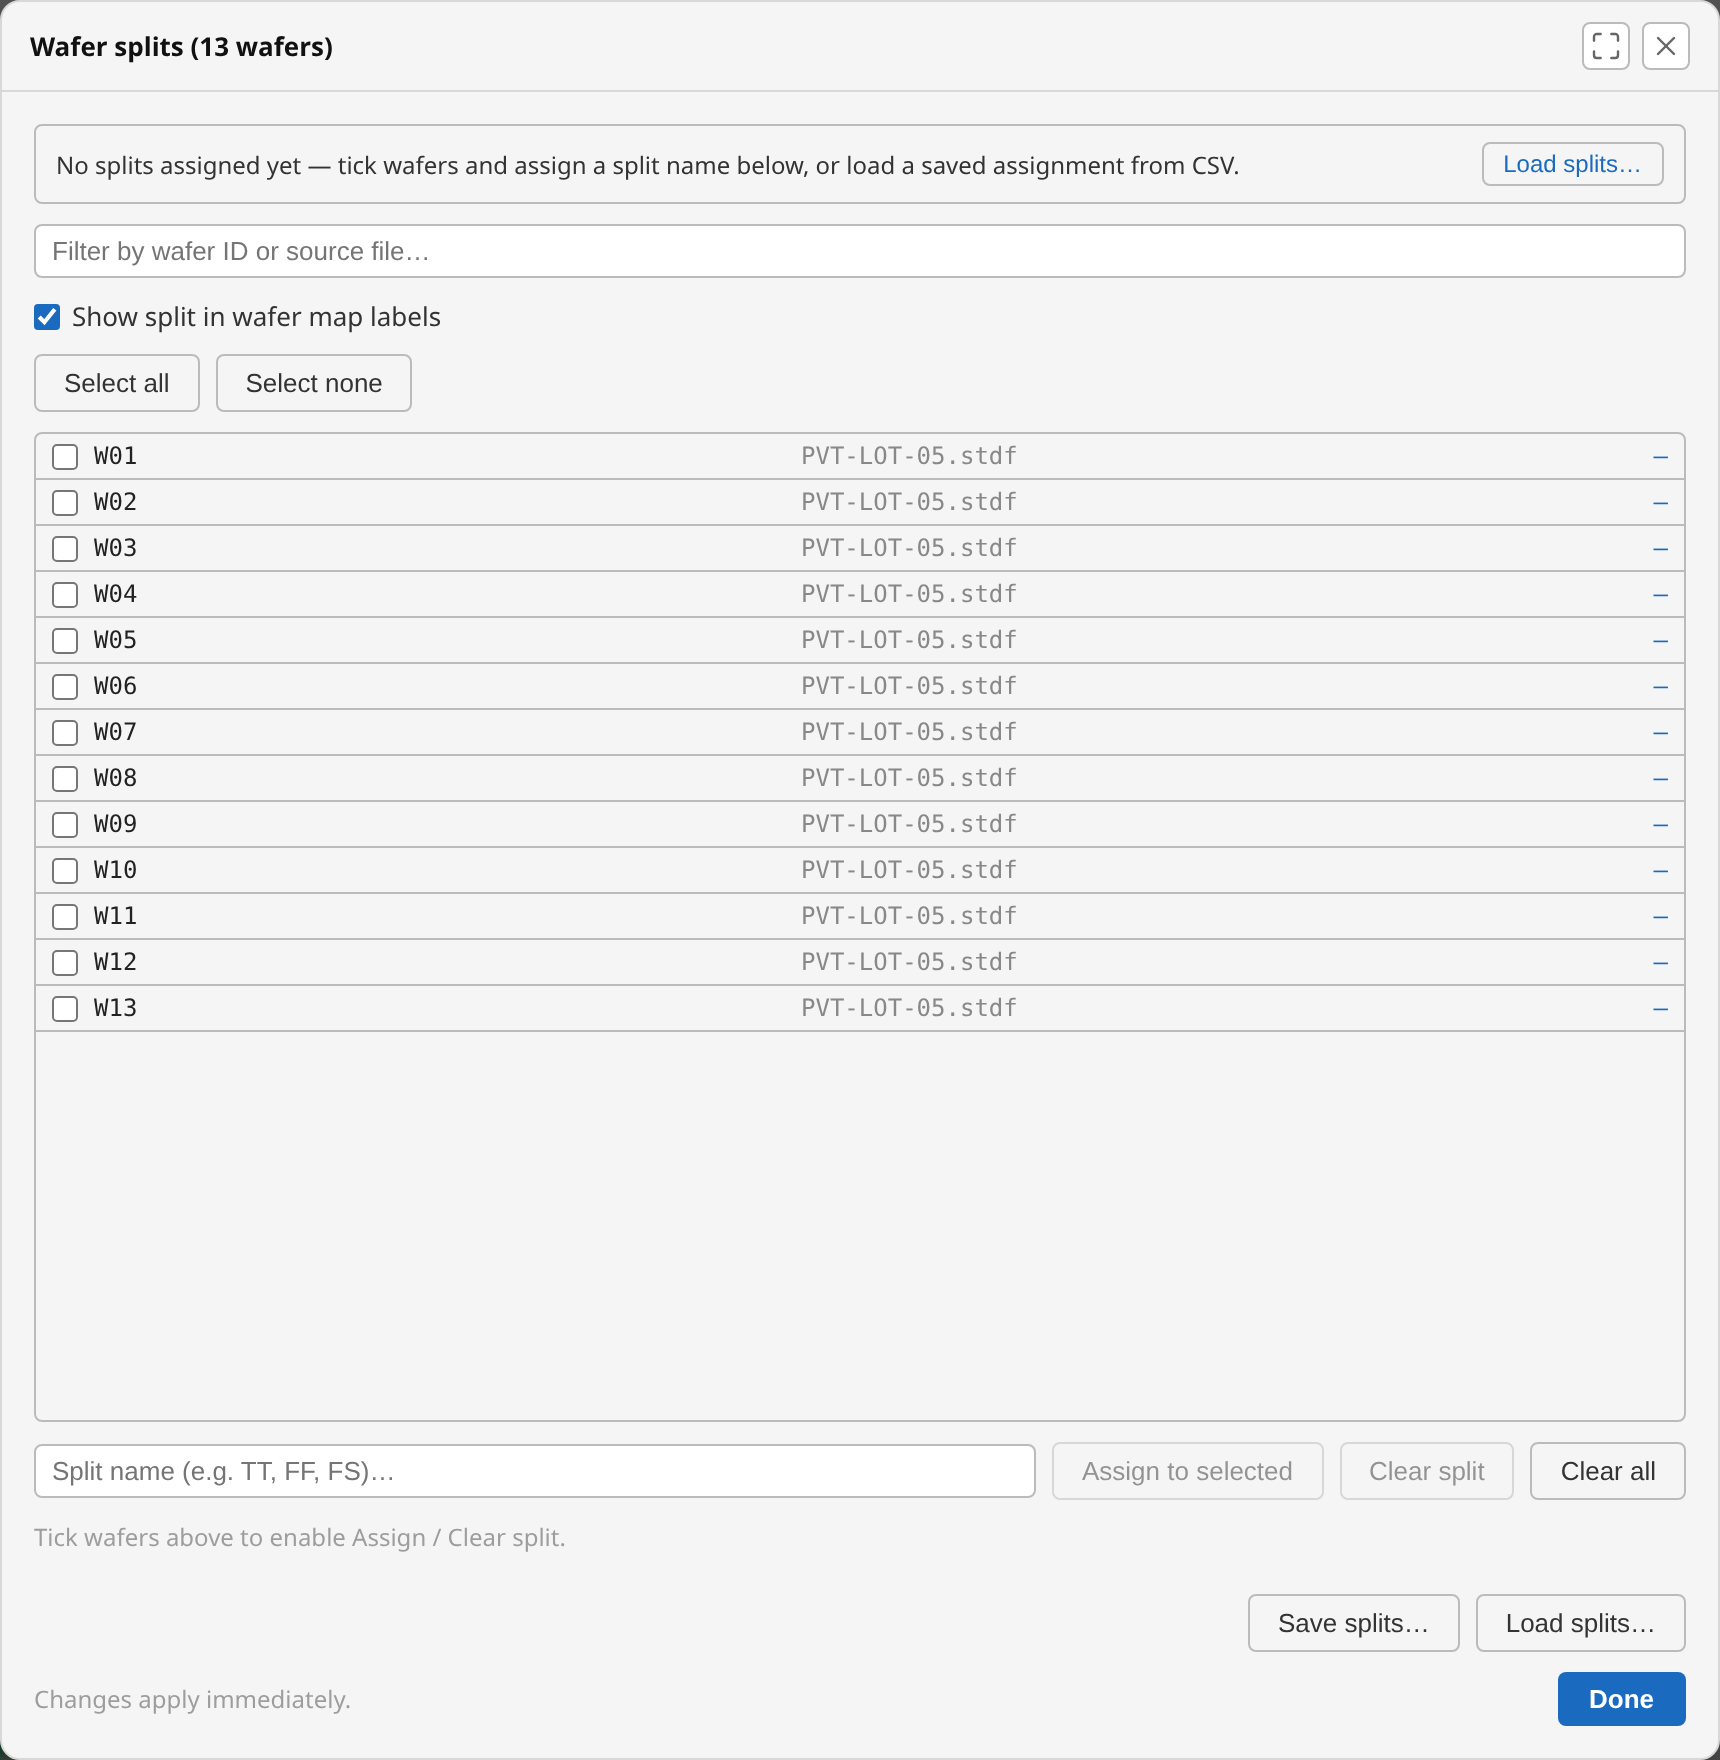
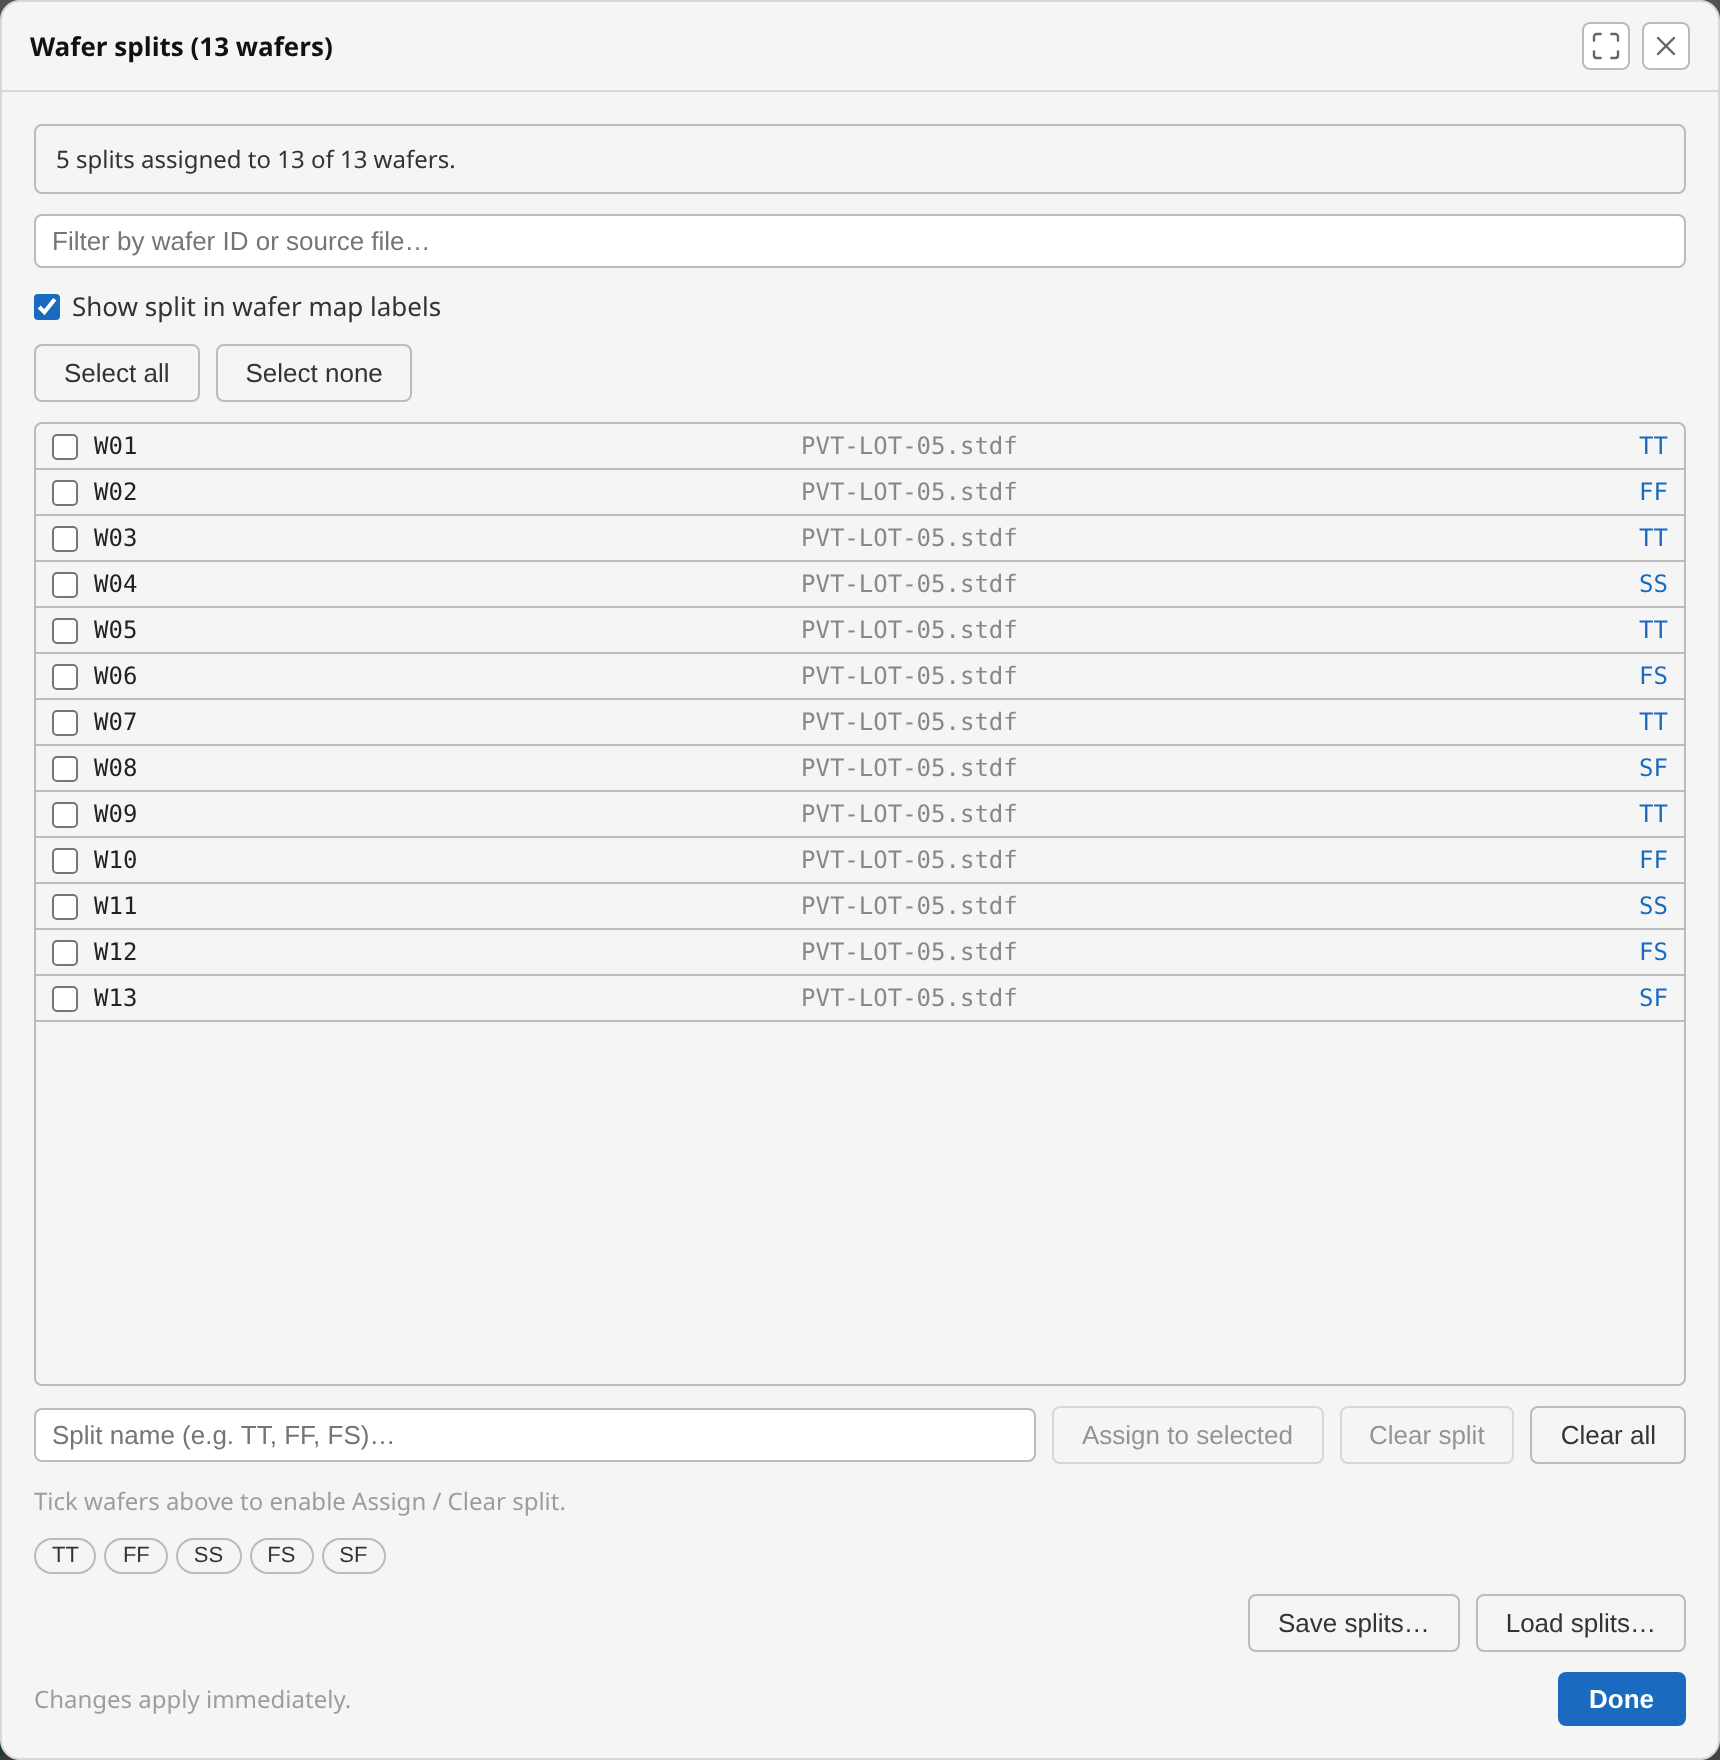
6.1 Assigning splits
Tick the checkbox next to one or more wafers — click to toggle, Shift-click to select a
range, same as the test selector — type a split name (or click one of the chips below the
input to reuse an existing name, avoiding accidental near-duplicates like TT vs tt),
and click Assign to selected. Clear split removes the assignment from just the
checked rows; Clear all removes every wafer's assignment at once (after a confirmation,
since it's not scoped to your current selection). Every action applies immediately — there
is no separate save step, and Done just closes the window.
Unlike the test selector, ticking wafers here is never required to proceed — it only scopes the Assign to selected and Clear split buttons, which stay disabled until at least one wafer is ticked. Loading a CSV, Clear all, and Save splits… ignore the selection entirely.
6.2 Showing splits on the wafer map
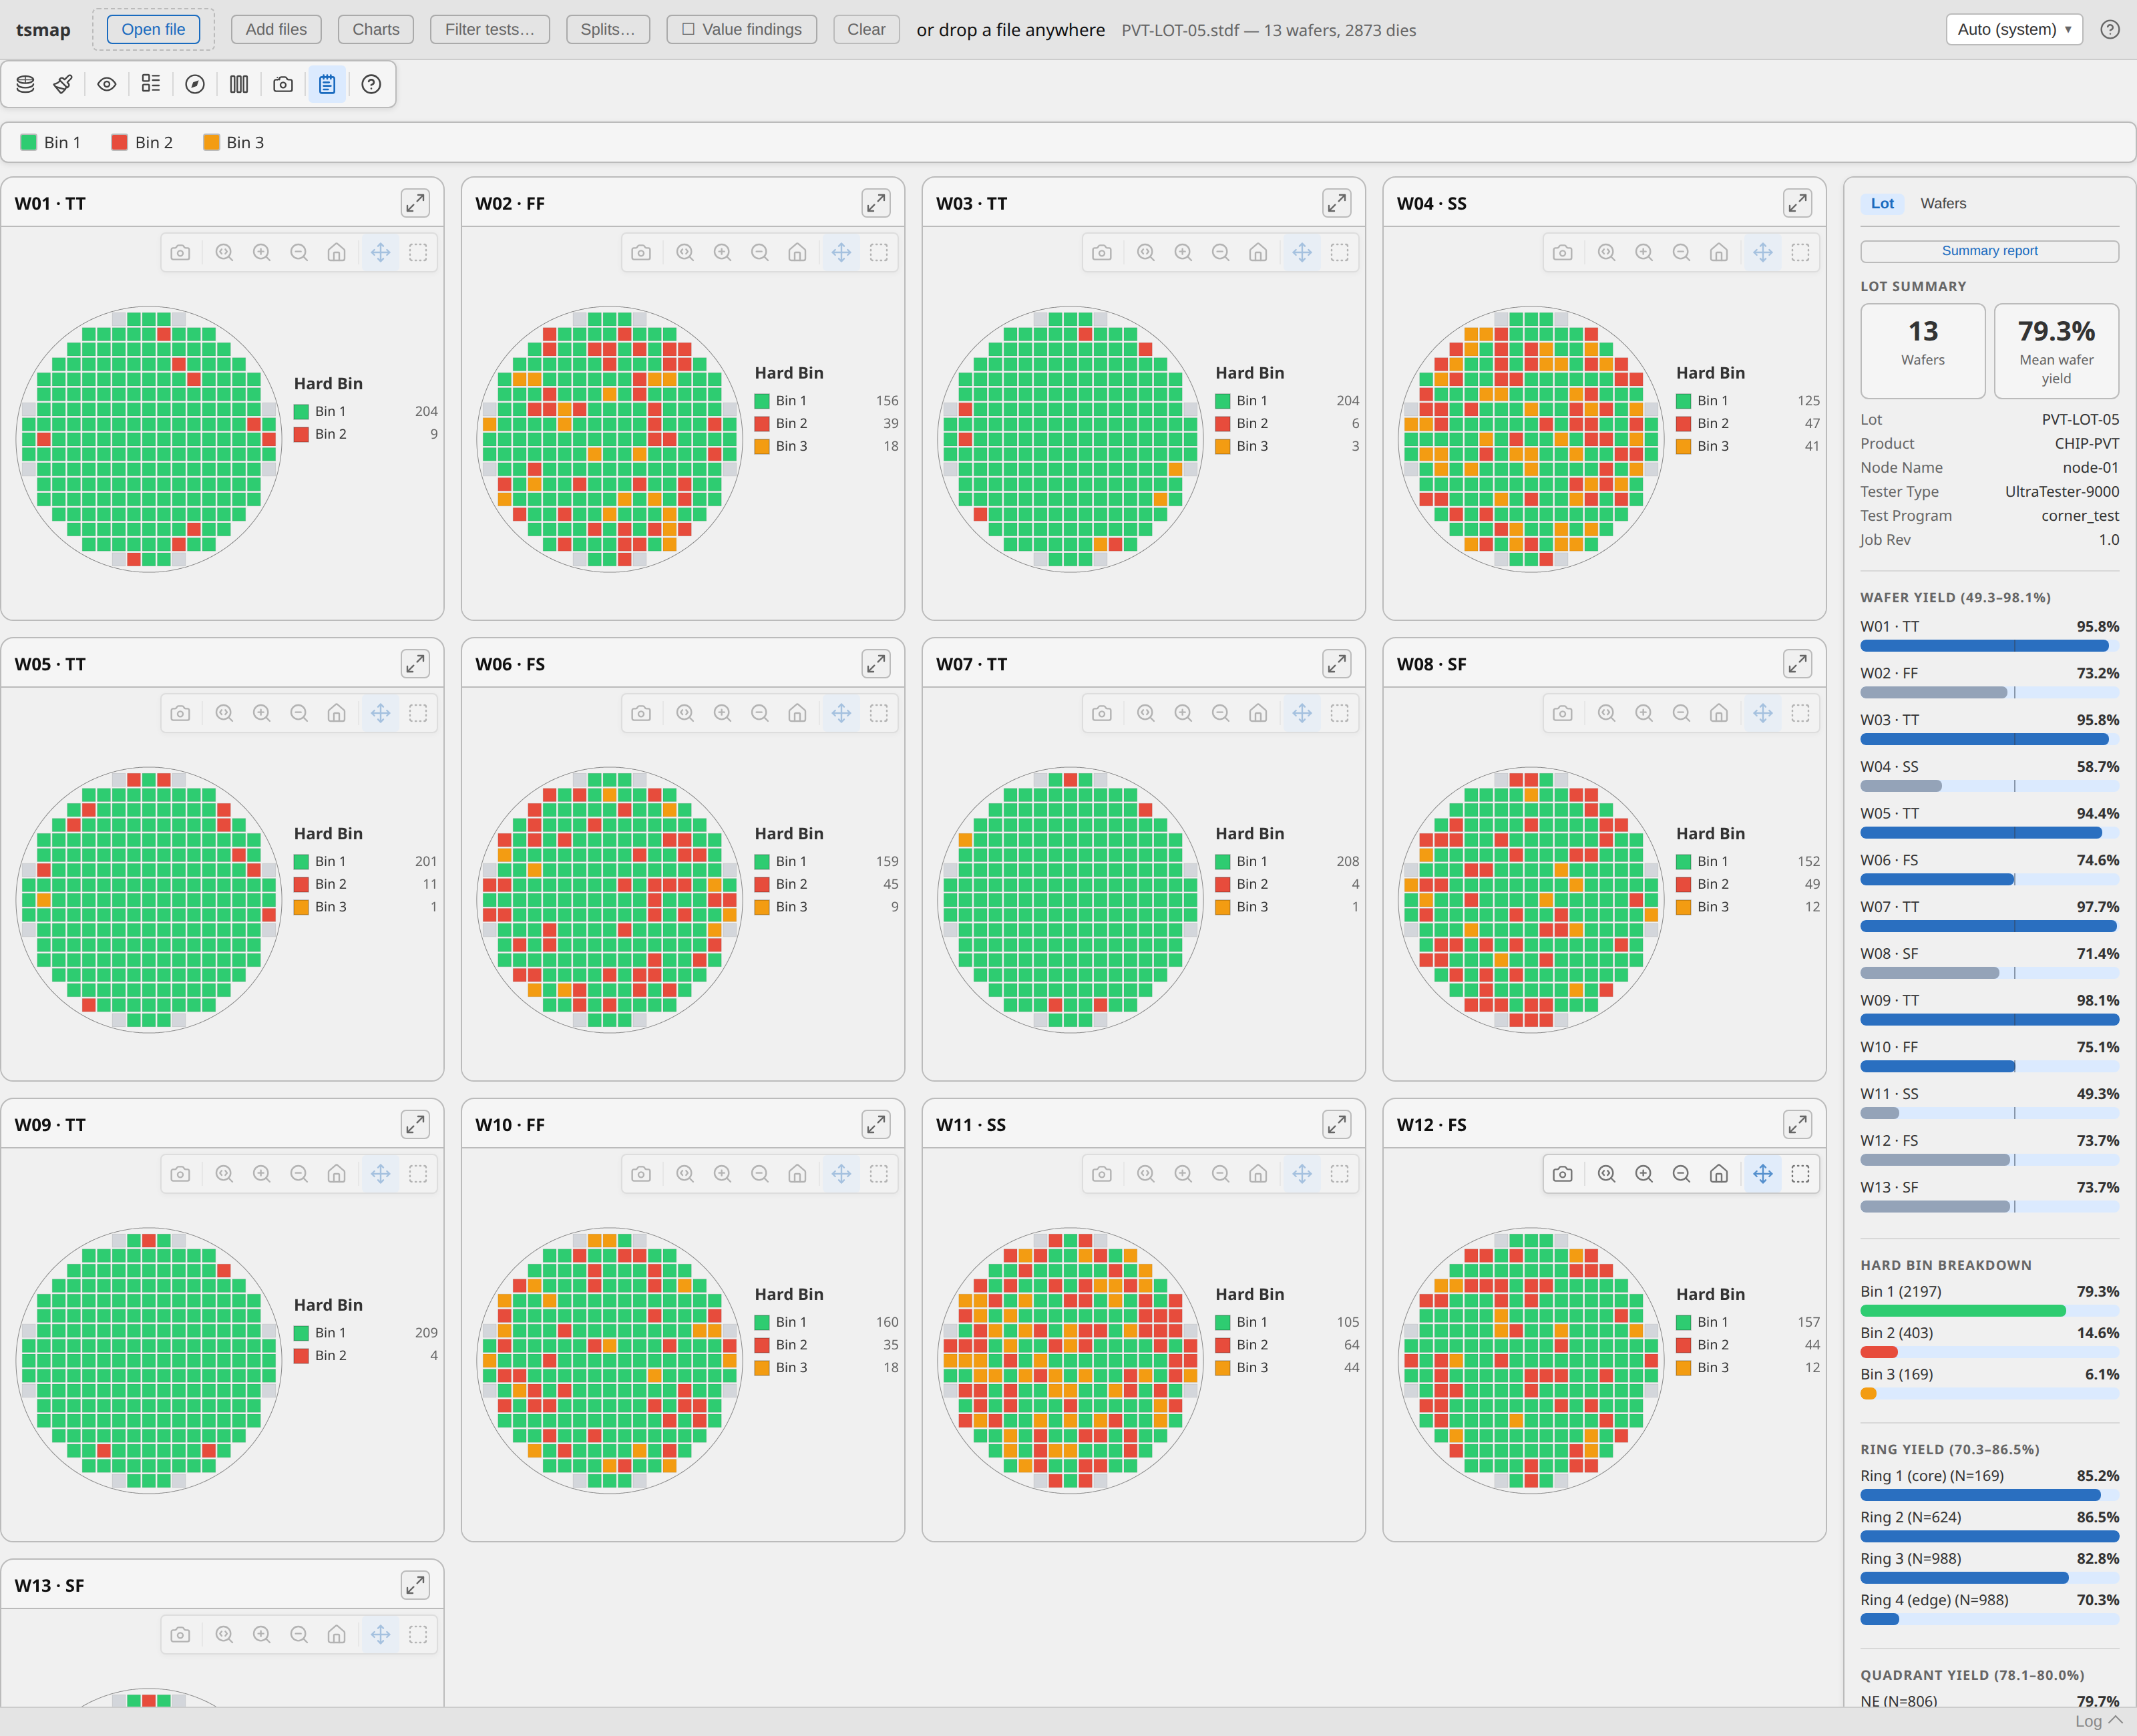
The "Show split in wafer map labels" checkbox (on by default) appends the split, as
W02 · FF, wherever a wafer's ID is shown — gallery card headers, the single-wafer view,
the summary panel's Wafer Id row, and drilldown modal titles. Turn it off to see plain
wafer IDs again; the underlying assignments are unchanged either way.
6.3 Saving and loading split definitions (CSV)
Save splits… writes every wafer's current assignment to a CSV file; Load splits… reads one back and applies it by matching wafer IDs — wafers in the file that aren't in your currently-loaded set are silently skipped, and a log message reports how many rows matched. This is the way to prepare a split definition ahead of time (e.g. from a fab's lot traveler) and apply it after loading the STDF, or to share a known-good corner mapping with a colleague. The format is a simple two-column CSV:
# tsmap wafer splits
# Saved: 2026-07-08T10:40:00.000Z
waferId,split
W01,TT
W02,FF
W03,TT
- Lines starting with
#are comments and are ignored on load. - The header row (
waferId,split) is optional — tsmap recognises and skips it either way. - A wafer listed with an empty split value is treated as explicitly unassigned.
6.4 Restoring splits automatically
tsmap remembers split assignments per lot ID + wafer ID (plus part type, if present) — the physical wafer's identity, not the file it arrived in — so re-opening the same lot later restores them without reloading the CSV, even if that lot is split across several files (for example, one file per test temperature). This restore is never silent: if any assignment is found for the wafers you just loaded, tsmap logs a message and automatically opens the Splits dialog so you can see exactly what was restored, edit it, or clear it — rather than silently changing chart groupings and map labels behind your back.
7. Insights tab
The Insights button in the map toolbar (both the single-wafer view and the gallery have their own) switches to wmap's own grid of statistical panels — yield, bin pareto, process capability, boxplot, histogram, correlation, and scatter — sharing the same parsed, in-memory data as the map, so switching never re-parses.
This is entirely a wmap feature. Every panel, its controls, and its grouping/drill-down behaviour are documented in full in wmap's own built-in guide — see the note at the top of this document for how to open it. This section covers only the two things that are tsmap-specific:
- Where the "Group by" field list comes from. Grouping is driven by metadata attached to each wafer at load time, plus any wafer splits you've assigned. STDF and ATDF contribute every field present in their MIR record — lot, sublot, part type, program, test temperature, test date, tester, node, operator, and more; CSV and JSON contribute the lot column plus any columns you mapped as metadata. Only fields that actually vary across the loaded wafers appear in the dropdown.
- A single-wafer load has nothing to group by, so every panel simply shows that one wafer's own data and the Group by control doesn't appear.
8. Exporting charts
Every chart panel has a camera button that saves the current view as a PNG at the displayed resolution. To get a clean full-resolution render, use the expand (corner-arrows) button first to open the panel in the fullscreen modal, then click the camera button.
Each exported PNG includes a header strip above the chart with the panel title, source filename, wafer and die counts, the active test name (where applicable), and the time of export. The live card UI is unchanged — the header appears only in the saved file.
On the desktop, PNG saves open a native save dialog. In the browser, the file goes to your downloads folder.
For map PNG export, use the camera button in the map toolbar — see the wmap help for details.
9. The log panel
A collapsible log panel sits at the bottom of the window. It shows timestamped messages from the parser and renderer: file load events, parse warnings, and any errors.

- Click Log to expand or collapse the panel.
- If any errors occurred, the button label changes to Log (N errors) and the panel expands automatically.
- Parser warnings (e.g. fabricated soft bin numbers from sentinel values, unrecognised records) appear here rather than blocking the load.
Soft bin 65535 is a sentinel value in the STDF spec meaning "no soft bin assigned to this die". When the parser encounters it, it maps those dies to a fabricated soft bin so the wafer map can render — the hard bin value is unaffected. The number in the warning (e.g. "fabricated bin 2 for 14 dies") is the count of dies where this substitution was applied. If soft bin data is not meaningful for your product, this warning can be ignored.
10. Desktop vs browser differences
| Feature | Desktop | Browser |
|---|---|---|
| File parsing | Native Rust (fast, off UI thread) | WASM in a Web Worker (same logic) |
| File picker | Native OS dialog | Browser dialog |
| Drag and drop | Yes | Yes |
| PNG save | Native save dialog | Browser download folder |
| Zip extraction | Native Rust | In-browser (fflate) |
| Offline use | Yes | Yes (once page loaded) |
The browser version is functionally identical to the desktop app. Files are parsed entirely in your browser — nothing is sent to a server.
Browser requirements: Chrome 80+, Firefox 113+, Safari 16.4+, Edge 80+.